Back to Blog
Predicting the Fed’s actions for fun and profit
What’s the federal funds rate
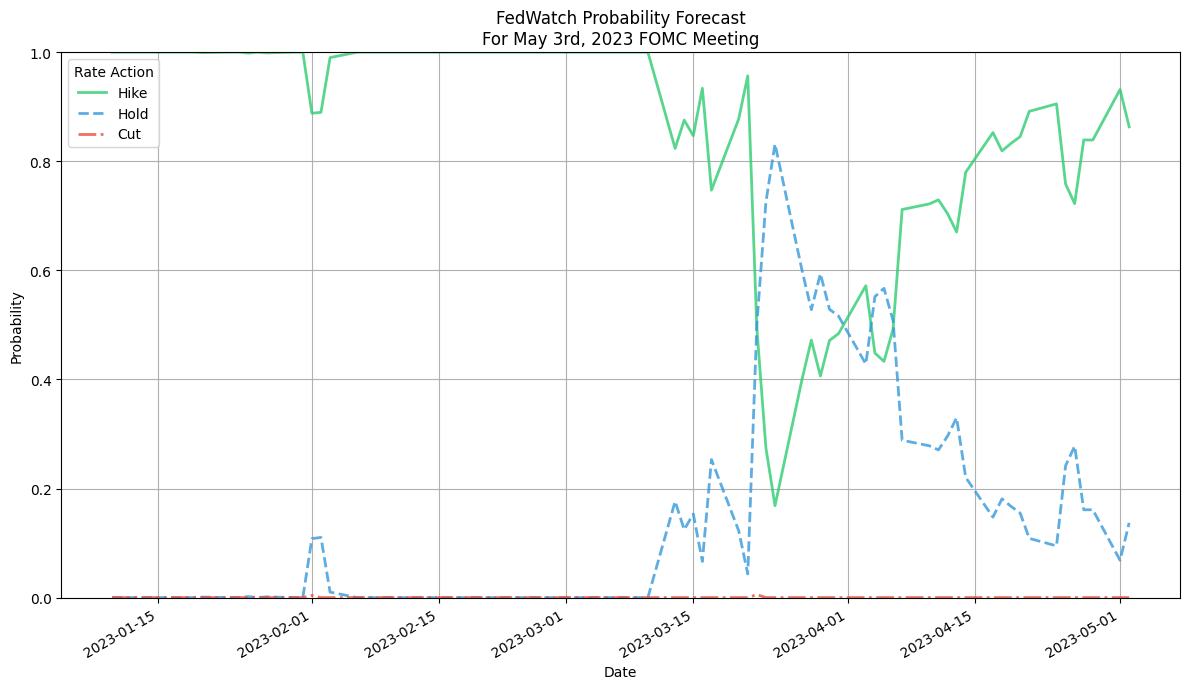
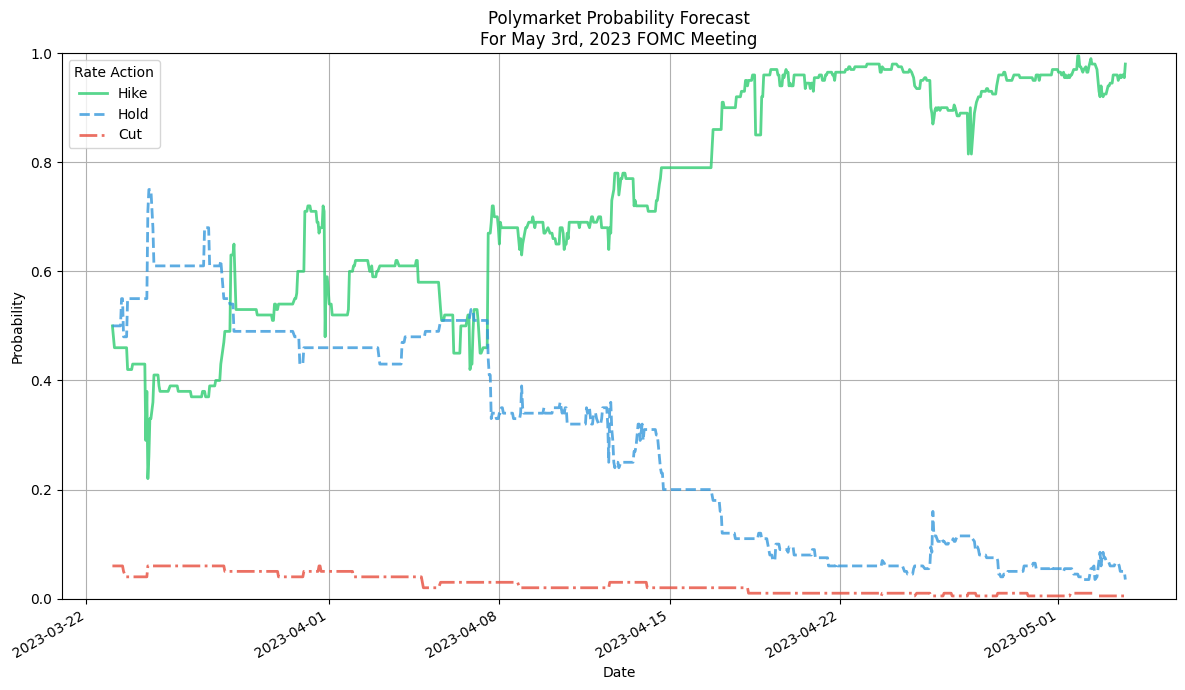
Is this the best we can do
Data digging
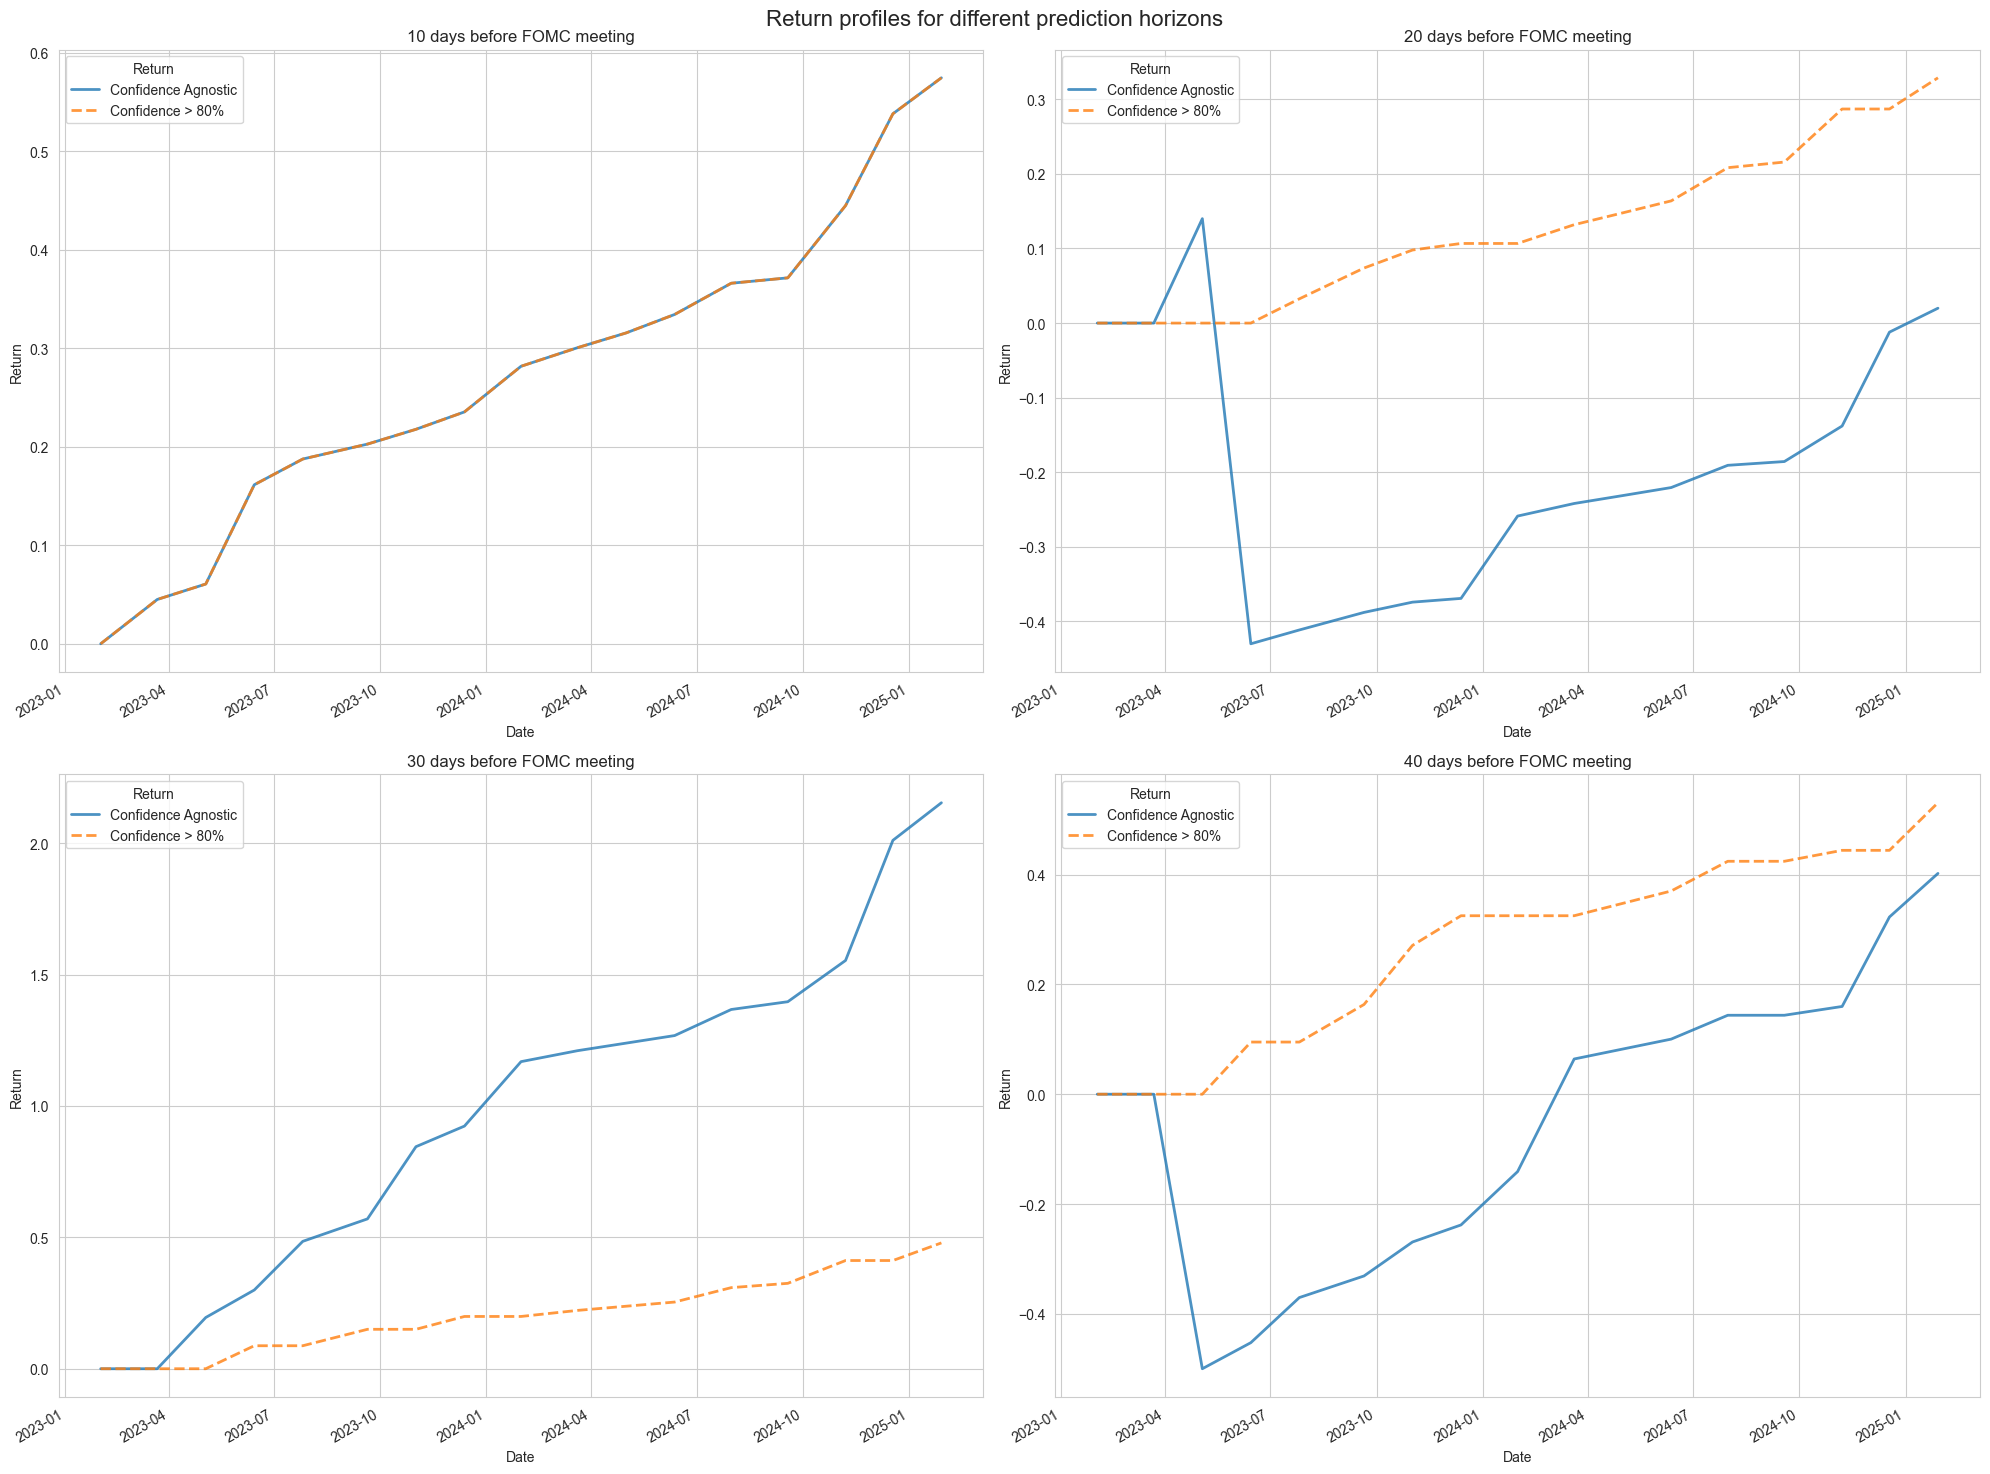
| Days to meeting |
No. meetings covered |
Mean accuracy |
Mean confidence |
| 10 |
18 |
1.0 |
0.95 |
| 20 |
18 |
0.94 |
0.89 |
| 30 |
18 |
1.0 |
0.86 |
| 40 |
18 |
0.94 |
0.89 |
| 50 |
19 |
0.88 |
0.86 |
| 60 |
19 |
0.83 |
0.85 |
| Days to meeting |
No. meetings covered |
Mean accuracy |
Mean confidence |
| 10 |
18 |
1.0 |
0.94 |
| 20 |
18 |
0.94 |
0.88 |
| 30 |
17 |
1.0 |
0.85 |
| 40 |
17 |
0.93 |
0.84 |
| 50 |
9 |
1.0 |
0.78 |
| 60 |
6 |
1.0 |
0.72 |
A strategy
The long view
