
The half-life of a Wikipedia trend
You have read this piece before. Our attention spans are collapsing, the internet has sanded them down to a nub, nobody can sit with a thought for longer than a scroll. It is a satisfying thing to believe, partly because it flatters the reader — you, unlike everyone else, are still capable of finishing an article — and partly because it is, in a narrow and well-evidenced sense, true.
It is also testable, which is more interesting. Since 2016 I have been scraping the hundred most-viewed Wikipedia articles every single day and dumping them into a CSV. That is 3,856 days, 385,600 rows, and 55,228 distinct articles: a decade-long record of what the English-speaking internet bothered to look up. If collective attention really is speeding up, this is where it should show.
It isn't there. On Wikipedia, attention has been getting slower for ten years, and the paper that established the shrinking-attention result had already noticed the same exception and let it pass in a single sentence.
What the data actually is
Every morning a GitHub Action asks the WikiMedia pageviews API for the previous day's hundred most-viewed English Wikipedia articles across all access methods, drops the reserved namespaces so that Main_Page and friends don't eat the chart, and appends the rest to the file. It has been doing this without supervision since January 2016, which means the dataset has the one property you cannot retrofit: nobody chose what to keep after the fact.
It is also unusually clean for something that has run unattended for a decade. Exactly 100 rows on every single day, no duplicate article-day pairs, and eight missing calendar days out of 3,864. I have written analyses on far worse.
One detail matters more than it looks. The top 100 is a fixed-size stage — exactly one hundred slots, every day, forever. Nothing can enter without something else leaving. Hold onto that; it does a lot of work later.
What shrinking would look like
If collective attention is accelerating, the prediction is specific. Topics should arrive, spike, and get shoved out faster than they used to. The daily top 100 should churn harder: more new faces each morning, fewer articles managing to hang around, more one-day wonders.
So the measurement is churn. For every pair of consecutive days, what share of today's top 100 was not in yesterday's? Call it turnover. It needs no model, no threshold, no arbitrary definition of "a trend" — just set arithmetic on the raw data. If the shrinking-attention thesis holds, turnover goes up.
Data digging
Here is the part where I tell you the sourcing was agony. It wasn't. The whole dataset is one curl away, because I have been paying the collection cost in one-second increments every morning for ten years. Deferred gratification is underrated in data work.
The genuine difficulty was definitional. A "trending run" — a streak of consecutive days in the top 100 — sounds simple and has three ways to lie to you.
Runs that touch either end of the dataset are censored: Star Wars: The Force Awakens appears to have a 54-day run starting on 2016-01-01, but that is just the day my scraper switched on, and the film had been out for a fortnight. Those get dropped. The eight missing days would each split one run into two if you measure consecutiveness in calendar dates, so runs are measured in observed-day ordinals instead. And perennials are not trends at all: United_States has been in the top 100 on 3,042 of 3,856 days. It is furniture, not news.
Even the raw numbers are strange in ways worth pausing on. 24,469 articles — 44% of everything that has ever charted — appeared exactly once in ten years and were never seen again. Meanwhile Cleopatra has a single unbroken run of 1,573 days beginning in November 2020. I have no idea why. She is simply always there, outlasting every war, election and celebrity death in the dataset, a queen dead for two thousand years quietly holding a slot against the entire news cycle.
The wrong direction
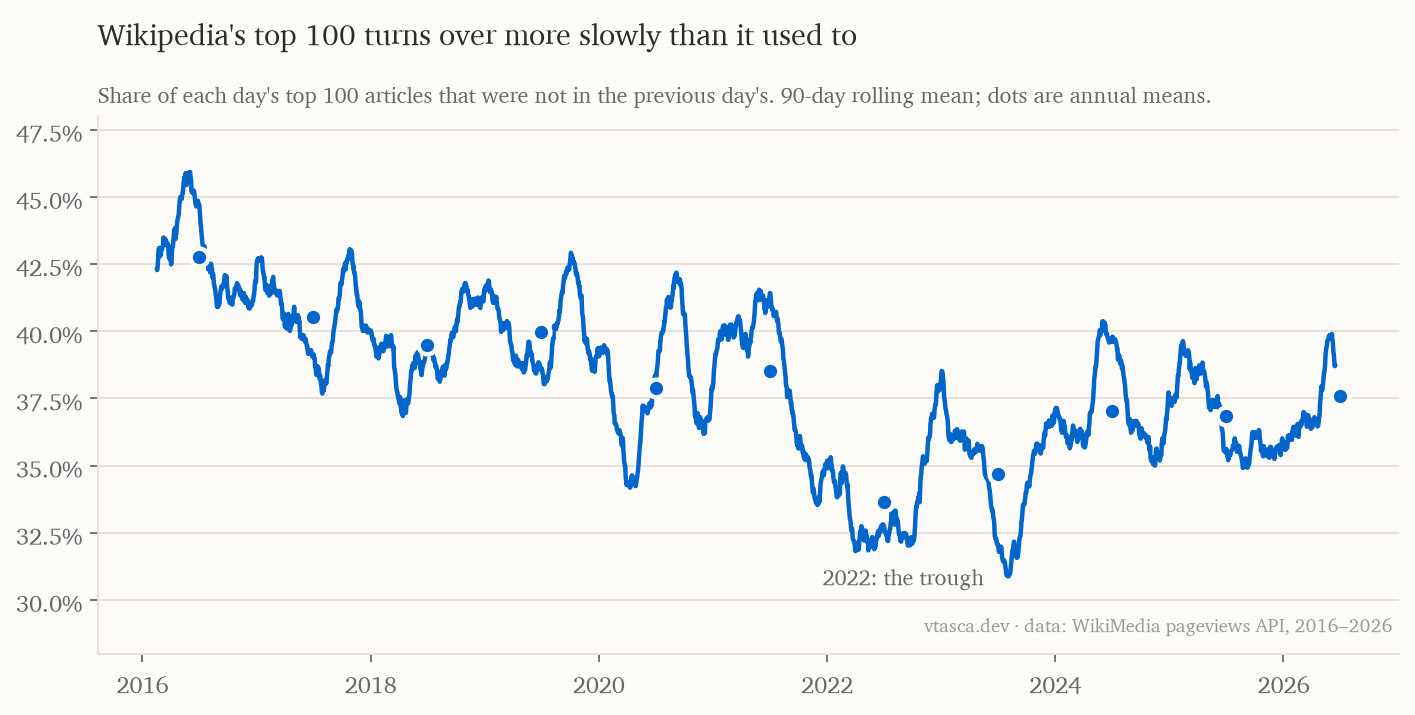
Turnover in 2016 averaged 42.8%. In 2025 it averaged 36.8%.
Daily turnover in the Wikipedia top 100, 2016-2026
That is a decline of six percentage points — a relative fall of 14% — on a trend of −0.73 percentage points per year (p = 0.005, r² = 0.65). Fewer new faces each morning, not more. Whatever is happening to collective attention on Wikipedia, it is the opposite of acceleration.
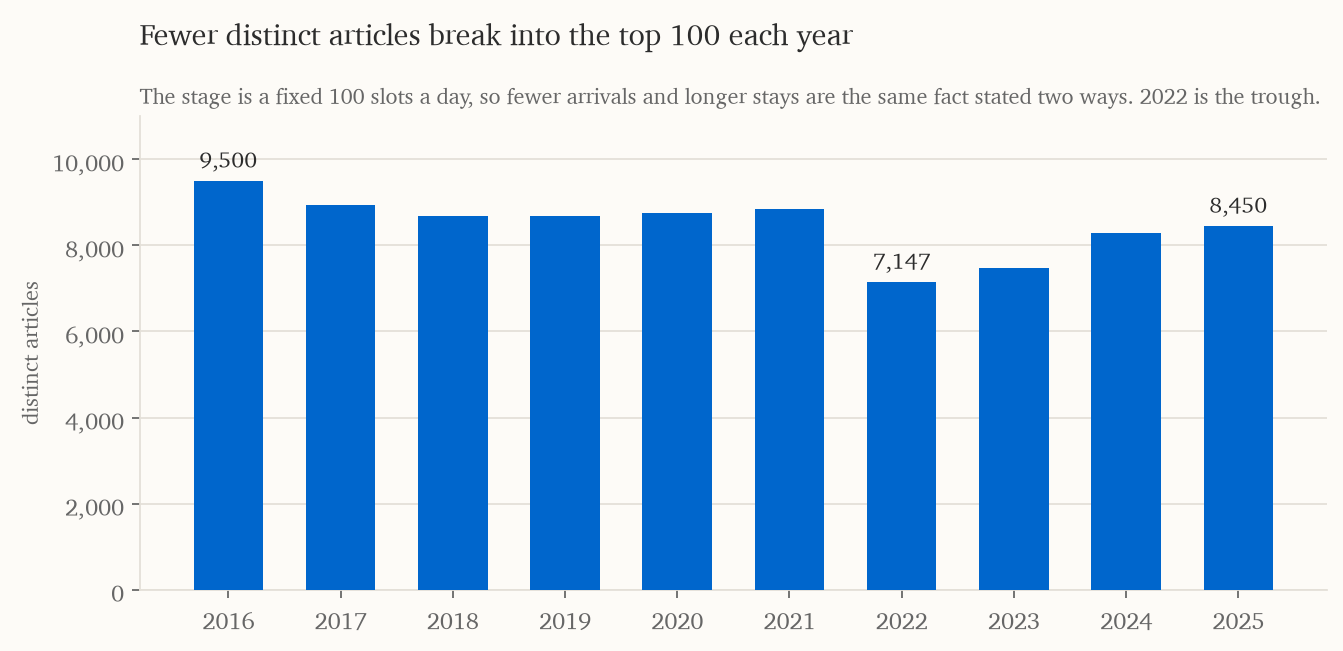
The same result shows up in every other way of asking. Mean run duration rose from 2.40 to 2.68 days. The share of runs lasting exactly one day fell from 65.8% to 56.7%. The number of distinct articles that broke into the top 100 in a year fell from 9,500 to 8,450.
Distinct articles reaching the top 100 each year
Those are not four independent findings, and I would be overselling badly if I presented them as such. Remember the fixed stage: one hundred slots times 365 days is about 36,500 article-days a year, and that total cannot change. So the number of runs multiplied by their mean duration is pinned to a constant. "Fewer things trend" and "each thing trends for longer" are one fact wearing two hats. The verification is unglamorous and I ran it anyway: 15,614 runs × 2.40 days = 37,500 article-days in 2016; 13,381 × 2.68 = 35,900 in 2025. Both land where the arithmetic says they must.
The half-life of a trend
Turnover is one number per day, which is a lot of information thrown away. The richer question is decay: given that an article is in the top 100 today, what are the odds it is still there tomorrow, or in a week?
Survival curves for trending runs, 2016-2018 versus 2023-2025
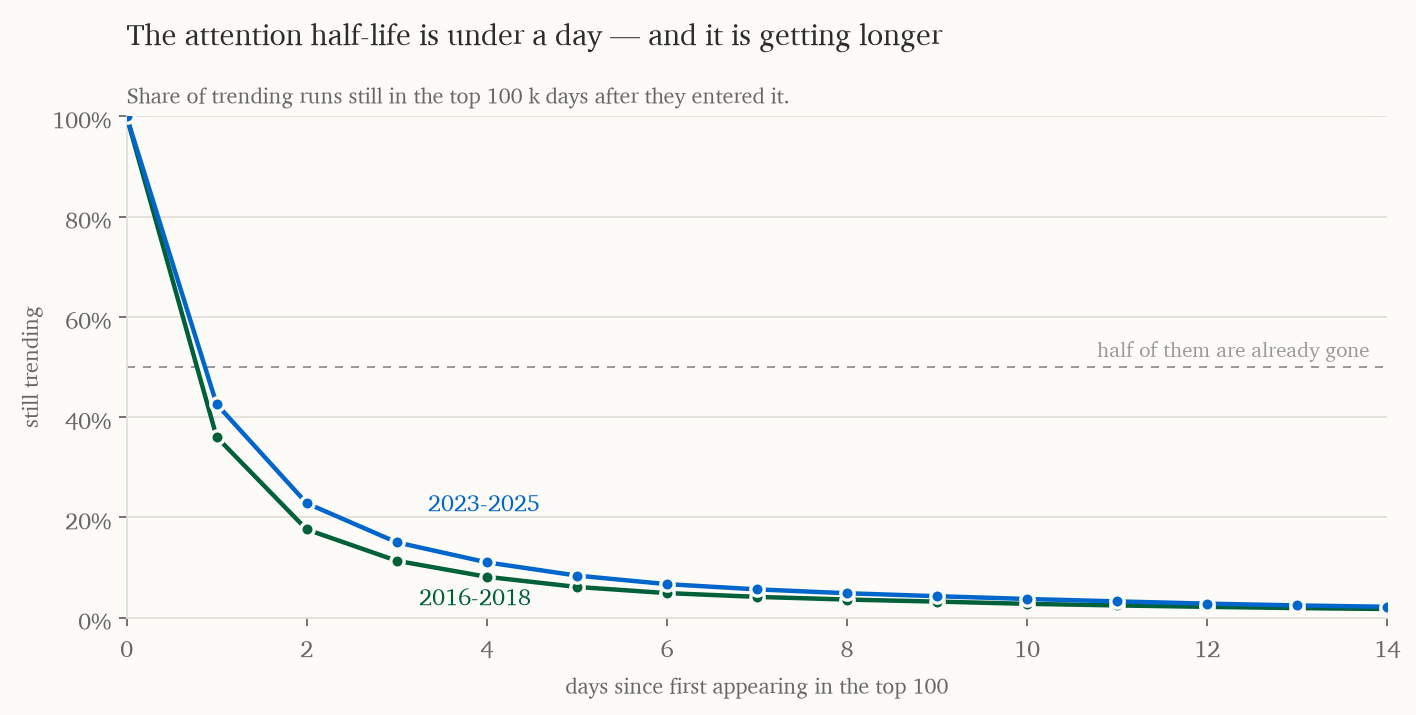
The shape is brutal, and it is the best argument for the shrinking-attention thesis in the whole dataset. The median trending article does not survive to the next day: depending on the era, between 57% and 64% of runs last exactly one day. The attention half-life of a Wikipedia trend is under a day.
That figure comes with an asterisk I should hand you rather than bury. The data is daily, so the curve crosses 50% somewhere between the first and second observation and interpolation is the only way to put a number on it. I get about 0.87 days. I would not defend the decimal — only the statement that it is less than one.
But compare the two curves and it has been getting less brutal. The interpolated half-life rose from 0.76 days in 2016 to 0.88 days in 2025, a 16% increase. The odds of surviving a full week rose from 3.8% to 5.6% — a relative jump of 47%, though I would rather state it as "one in twenty-six became one in eighteen", which is more honest about how marginal both numbers are.
Trying to break it
A result that contradicts the consensus deserves a serious attempt on its own life. There are four ways this could be an artefact, and I went after all of them.
The bar could have moved. If it got harder to reach the top 100, the composition would change for reasons having nothing to do with attention. It didn't: the number of views needed to claim the hundredth slot sat between 32,800 and 39,800 for the entire decade, with no trend. The stage is the same height it always was.
Squatters could be crowding out the news. If perennials like Cleopatra and YouTube have colonised more slots over time, turnover falls mechanically. Removing all 58 articles that have spent more than a year in the top 100 changes nothing: −0.71 points per year, p = 0.002.
It could be robots. The top 100 has obvious contamination — XHamster held a 1,173-day run, F5_Networks and Microsoft_Office chart regularly, and Ansel_Adams spent 217 days trending in 2025 for reasons I cannot explain and have stopped trying to. Strip out the 25 most obviously navigational titles and the decline survives at −0.64 points per year, p = 0.007.
It could be 2022. Turnover bottoms out hard that year, and 2022 had a war that ran continuously for ten months, a monarch's death, and Elon Musk buying Twitter. A single unusually sticky news cycle could be doing the work. Cut 2022 and 2023 out entirely and the trend across the remaining years is steeper, not shallower: −0.82 points per year, p = 0.018, r² = 0.79.
Where this gets weaker
Now the part I would want to read if someone else had written this.
The trend is not monotonic, and I have been quietly rounding that off. Turnover falls from 2016 to a trough in 2022, and then it comes back — 33.7% in 2022, 37.0% in 2024, 36.8% in 2025. Fit a line to 2023 onwards and it points upward at +0.85 points per year. That fit is not statistically significant (p = 0.14) and three points is not a trend, but neither is it nothing. The defensible claim is "turnover in the mid-2020s is well below where it was in the mid-2010s", not "turnover is falling and will continue to".
The effect is small. Comparing 2016–2018 against 2023–2025 gives a rank-biserial correlation of +0.07, where zero is no difference at all. The p-value on that comparison is around 10⁻⁹⁹, which sounds impressive and means almost nothing: with 84,000 runs you can resolve differences far too small to care about. The median run duration is one day in every single year of the dataset. What moved is the tail, not the typical case.
This is not your attention span. It is a measurement of what a large population collectively looked up, aggregated to a hundred slots a day. Nothing here says anything about whether any individual human can concentrate, and a study design that could would look nothing like this one. If you came here for vindication about your own reading habits, I cannot help.
And Wikipedia is not the internet. It is a reference work. People arrive with a question, not a feed. That is exactly why the result is interesting — but it also means this generalises to precisely nothing else.
The paper that already found this
Here is where it gets good. There is an excellent 2019 Nature Communications paper by Lorenz-Spreen, Mønsted, Hövel and Lehmann called "Accelerating dynamics of collective attention", and it is the serious empirical backbone of the shrinking-attention claim. They looked at seven datasets: Twitter, Google Books, box office, Google Trends, Reddit, scientific citations, and Wikipedia.
Their Twitter result is striking. The average time a hashtag spent in the top 50 fell from 17.5 hours in 2013 to 11.9 hours in 2016 — roughly a third, in three years. Their model attributes it to more content competing for a fixed pool of attention, which exhausts faster as production rises.
And then there is one sentence about the exceptions: "for scientific citations and traffic on Wikipedia pages, there is negligible growth of relative gains and losses." Two of their seven datasets didn't do it. They noted it, suggested that knowledge-based systems might run on different mechanisms, and moved on — reasonably, since Wikipedia was one dataset among seven and they had five that agreed.
What I can add is a longer lever. Their Wikipedia window was 2012–2017. Mine is 2016–2026, and over that decade Wikipedia does not merely fail to accelerate — it decelerates, on every metric I can construct. The exception in their footnote holds up, and then some.
I find this more satisfying than a clean refutation would have been. The shrinking-attention thesis is not wrong; it is specific. It describes what happens on platforms that push content at people. It does not describe what happens on a platform people go to with a question in mind. That distinction gets flattened every time the finding is repeated as "attention spans are shrinking", and the flattening is doing real damage to a good result.
But what about the robots
One obvious objection: ChatGPT launched in November 2022, roughly where turnover bottoms out. If AI assistants are answering the questions people used to bring to Wikipedia, the top 100 might now be a different, weirder animal.
I cannot settle this with the top 100 alone — it tells you nothing about total traffic, only about the shape of the peak. But the peak has not caved in. Total views across the top 100 averaged 8.5 million a day across 2019, 2021 and 2022, and 9.0 million across 2024 and 2025: up about 5%. Whatever AI is doing to Wikipedia, the most-read hundred articles are not visibly emptier than they were before ChatGPT existed.
There is a nice irony in the detail: ChatGPT itself has been in the top 100 for 357 days of 2025 and holds a 450-day unbroken run of its own. It is now one of the sticky perennials suppressing the turnover statistic. Make of that what you will.
So what
Ten years of daily data, one hypothesis, and a result pointing the other way. The number I would actually keep is the ugly one: the median article that reaches the hundred most-read pages on Wikipedia is gone the next day, and has been for a decade. Collective attention on the internet's reference desk is not shrinking, but it was never large to begin with.
The slowdown is real, modest, robust to every attack I could think of, and unexplained. I have deliberately not offered a cause, because I do not have one that survives contact with the data — a more concentrated news cycle, a shifting reader base, and a slow accumulation of navigational junk in the rankings are all consistent with what I see, and I cannot separate them. That is a worse ending than a tidy explanation, and it is the one the evidence supports.
The next obvious move is to stop looking at the top 100 and get the full pageview firehose, where total traffic and the long tail are both visible and the AI question can actually be answered. That is a much larger dataset and a much larger post.
All of the analysis code and the dataset are on GitHub. The scraper runs tomorrow morning, as usual.